
New technologies are changing how people work, learn, and communicate, yet many of the most important innovations are hard to explain. Artificial intelligence, cloud computing, smart devices, and robotics are full of technical terms, unfamiliar concepts, and complex processes that leave most readers confused. Learning how to create infographic content to explain new technologies gives you a practical way to turn that confusion into clarity.
An infographic mixes short text with illustrations, charts, icons, and diagrams. Instead of asking someone to read a long technical document, it shows the idea in one visual story that can be absorbed in minutes. This guide explains how to create infographic content to explain new technologies explained in plain language, covering research, layout, visuals, writing, tools, and testing, so your next design actually helps people understand.

Key Takeaways: Start with one clear message, because an infographic that tries to cover everything confuses readers. Match the depth to your audience, since beginners need simple definitions and examples while advanced readers can handle diagrams and technical detail. Research from official documentation and recent sources, and separate confirmed facts from predictions. Pick the layout that fits the message: processes, comparisons, timelines, flowcharts, and data stories each need a different structure. Keep text short, visuals meaningful, colors limited, and always test the design on someone unfamiliar with the topic.
What Does It Mean to Explain New Technologies With Infographics?
Direct answer: It means converting a complex technical subject into a visual summary that a non-expert can understand in minutes. You break the topic into its key parts, pair each part with a supporting visual, and arrange them in a logical order so the reader can follow the story from start to finish without reading a manual.
A guide to how to create infographic content to explain new technologies is itself a good example of the idea. Artificial intelligence might be explained through a three-part visual: what it is, how it learns, and where it is used. Cloud computing might be shown as devices, remote servers, and the connection between them. The visual carries meaning that paragraphs alone struggle to deliver.
Why Are Infographics So Effective for Explaining New Technologies?
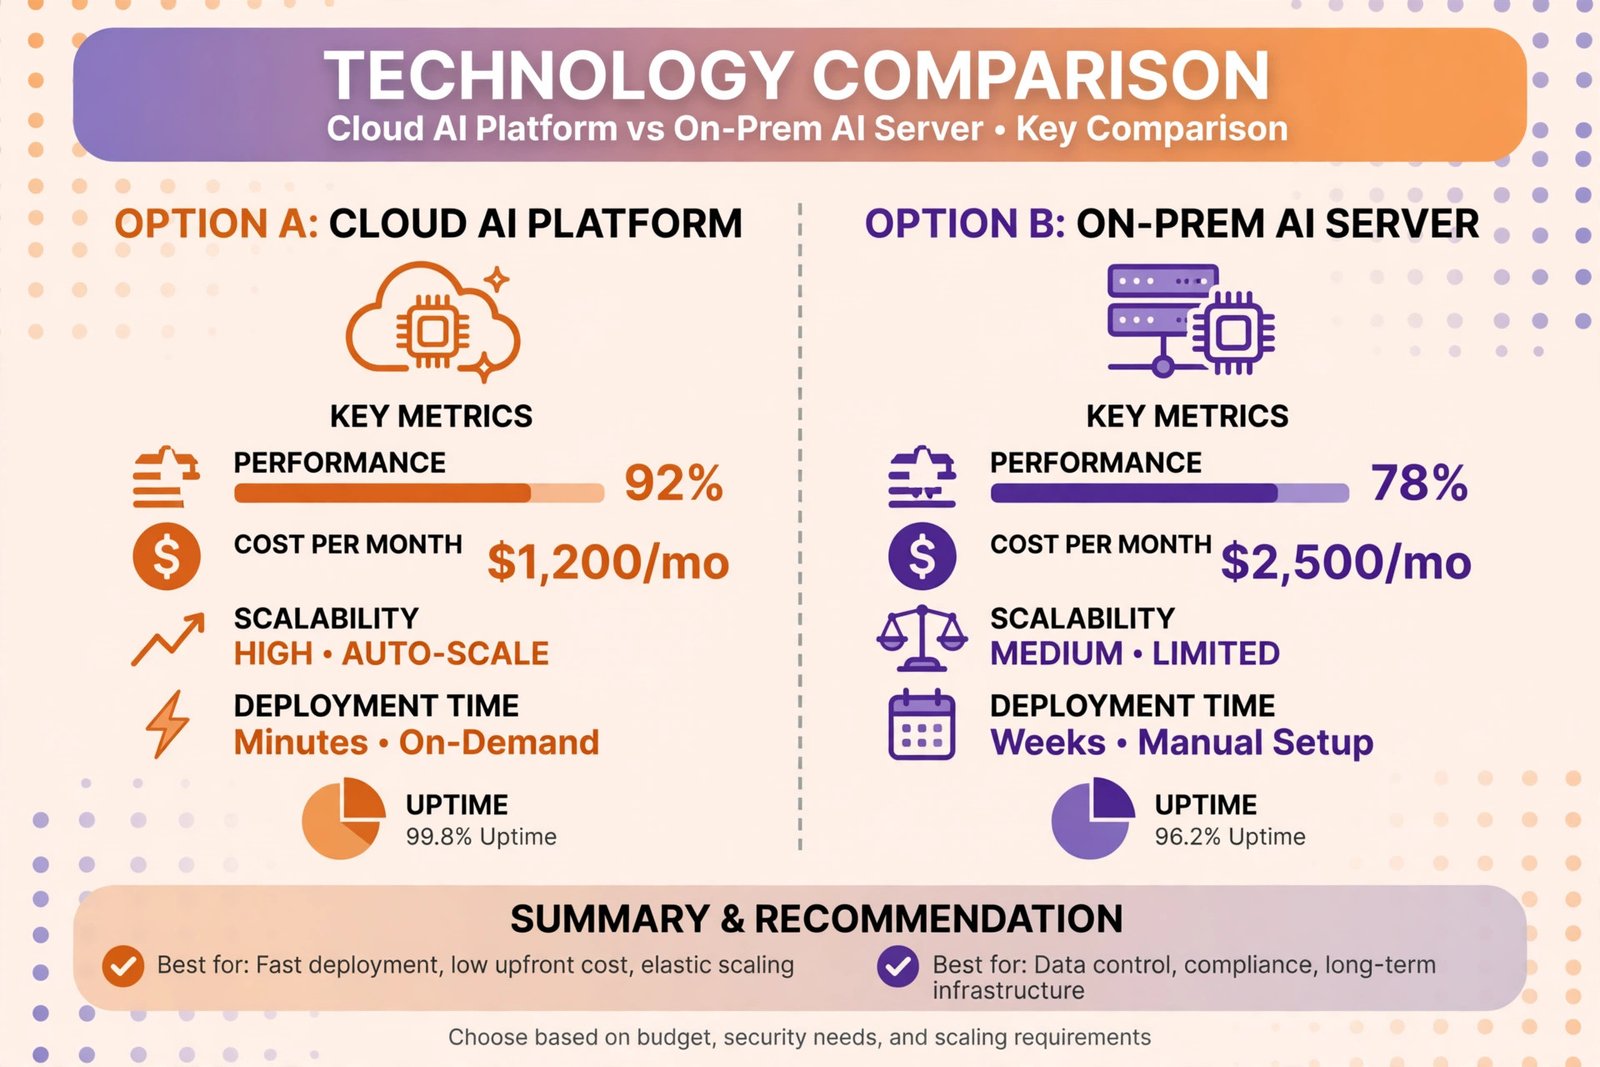
Direct answer: They are effective because new technologies usually involve processes, relationships, and systems that are easier to show than to describe. A picture of how data flows through a system communicates faster than three paragraphs about it, and a comparison chart makes the differences between two tools obvious at a glance.
Infographics also force you to simplify, which is exactly what technical topics need. When you only have room for a headline, a caption, and a visual per section, you must decide what truly matters. That discipline protects readers from jargon and detail they do not need. Among the how to create infographic content to explain new technologies benefits are faster understanding, more shares on social media, and content that works well inside blog posts and presentations.
Another benefit is memory. People remember visual stories longer than blocks of text. When someone can recall the steps of facial recognition or the layers of a smart home system from a single image they saw last week, the infographic has done its job. This is why technology teams, teachers, and marketers all reach for infographics when a concept feels too heavy for words alone. Legal technology shows the need clearly: learning how contract analytics helps legal teams reduce contract turnaround times becomes far easier when review stages are drawn as a visual story rather than described in paragraphs.
What Steps Should You Follow to Create Infographic Content?
Direct answer: Follow a clear sequence: define your message, research the facts, choose a layout, sketch the flow, write short text, add supporting visuals, and test before you publish. Each step protects the next one from mistakes, so rushing the early steps usually creates more work later.
- Define one clear message. Decide the single takeaway your audience should keep. One infographic might show how an AI system works, while another compares traditional software with AI-powered software.
- Know your audience. Beginners need simple definitions and everyday examples. Advanced readers may want comparisons, technical diagrams, or performance details.
- Research from reliable sources. Use official product documentation, research papers, university publications, and reputable technology organizations. Check publication dates for fast-moving topics.
- Choose the right layout. Match the structure to the message: processes, comparisons, timelines, and flowcharts each suit different kinds of information.
- Sketch the visual flow. Plan the order of sections before designing, so the reader can move naturally from the beginning to the end.
- Write minimal, plain text. Keep headlines short and captions to one or two sentences. Cut any sentence that does not support the main message.
- Test with a fresh reader. Ask someone unfamiliar with the topic to summarize the infographic. Fix whatever they misunderstand.
Which Infographic Layout Fits Your Technology Topic?
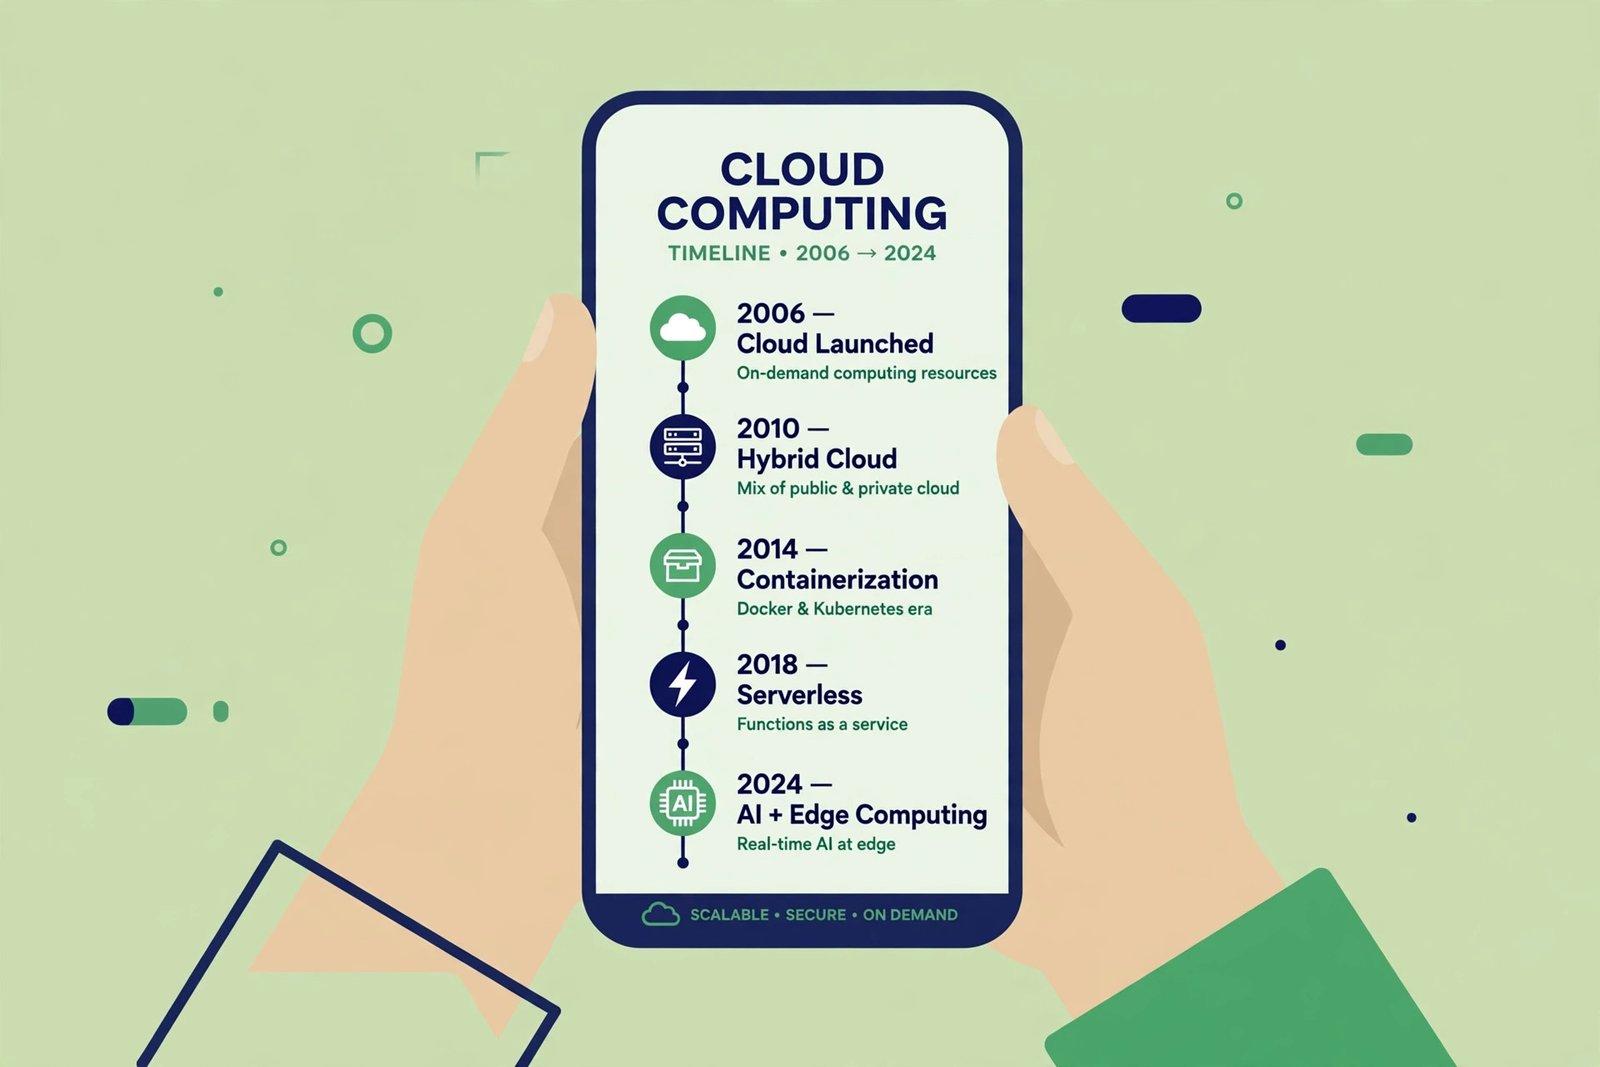
Direct answer: The layout should match the shape of your information. Use a process layout for how something works, a comparison layout for differences, a timeline for evolution, a flowchart for decisions or data flow, and a data layout for numbers and statistics.
| Infographic Format | Best Use Case | Tooling Examples |
|---|---|---|
| Process / how-it-works | Explaining steps, such as how facial recognition or machine learning works | Canva, Piktochart, Venngage |
| Comparison | Showing differences between two tools, such as traditional software vs AI software | Canva, Visme, Piktochart |
| Timeline | Showing the evolution of an innovation over time | Canva, Visme, Venngage |
| Flowchart | Mapping data flow or decisions inside a system | Lucidchart, Canva, Visme |
| Statistical / data | Presenting survey results or market numbers with charts | Visme, Tableau, Canva |
| Anatomy / labeled diagram | Breaking a system into labeled parts, such as a smart home setup | Adobe Illustrator, Canva, Piktochart |
Whichever layout you choose, keep the reading path obvious. Use section headings, group related items together, and leave enough white space so the text and visuals can breathe. A crowded layout defeats the purpose of a visual explainer, especially on mobile screens where most readers will see it.
Which Tools Can You Use to Design a Technology Infographic?
Direct answer: You do not need professional design training. Beginner-friendly tools like Canva, Piktochart, Visme, and Venngage offer templates, icons, and charts with drag-and-drop editing. Experienced designers may prefer Adobe Illustrator for full control, and diagram-heavy topics can benefit from Lucidchart. Pick a tool you can actually use well rather than the most powerful one available.
Choose a template that suits the topic and the audience rather than the flashiest one available. Then customize the fonts, colors, and icons so the design looks like an explanation, not a sales pitch. Before publishing, check spelling, contrast, alignment, and image quality, and view the design on a phone. To see how new technologies get explained in article form, read our guide to AI 3D modeling for pet products and animal enrichment, and for more stories on emerging technology, visit theweirdnewsblog.com.
How Should You Write the Text Inside Your Infographic?
Direct answer: Write less than you think you need. Use plain words, define any technical term you cannot avoid, and keep each section to a headline plus one or two short sentences. If a sentence does not support the main message, cut it.
Titles should tell readers exactly what they will learn. Captions should explain why the visual matters, not just repeat it. When a term like machine learning must appear, define it simply in the same breath, for example as software that improves at a task by finding patterns in data. Long paragraphs do not belong in infographics; if your text block needs scrolling, it needs editing.
How Do You Check Your Infographic Before Publishing It?
Direct answer: Review it with fresh eyes, then ask someone unfamiliar with the topic to summarize it back to you. If their summary matches your intended message, the design works. If not, the problem is usually too much text, an unclear order, or visuals that decorate instead of explain.
Check the technical details too. Confirm color contrast so text is readable on any background, and never carry critical meaning through color alone, since some readers cannot distinguish certain colors. Label every chart axis, name your data sources, and make sure charts do not distort the differences they show. Publish the finished infographic on your blog, social channels, or resource pages with a short description and links to deeper reading, then watch which sections get the most attention to guide your next design.
Frequently Asked Questions
What is the first step in how to create infographic content to explain new technologies?
Define a single clear message. Pick one question your infographic will answer, such as how a technology works or how two options compare. One focused message keeps the design simple and gives every visual a reason to exist.
How long should the text be in a technology infographic?
As short as possible. Aim for headlines, one or two sentence captions, and labels. If a section needs a full paragraph, the topic is probably too big for one infographic, so split it into a series.
Do I need graphic design skills to make an infographic about new technologies?
No. Tools like Canva, Piktochart, Visme, and Venngage provide templates and icons that non-designers can use. Design sense helps, but clear thinking about the message matters far more than artistic skill.
How do I make sure my technology infographic is accurate?
Research from official documentation, research papers, and reputable technology publications, and check publication dates for fast-moving topics. Separate facts from predictions, and double-check every statistic or technical claim before it goes into the design.
What are the how to create infographic content to explain new technologies benefits for businesses?
Businesses get faster customer understanding, more engaging blog and social content, and a reusable asset for presentations and sales pages. A clear visual can answer common questions before they reach the support team, saving time for everyone.
Where should I publish my infographic after creating it?
Publish it on your website or blog with a descriptive caption, share it on social media, and include it in newsletters or educational resource sections. Add a short introduction and links to deeper reading so interested readers can learn more.
Final Thoughts
Learning how to create infographic content to explain new technologies comes down to a simple formula: one clear message, reliable research, the right layout, plain language, honest visuals, and real testing. Do those well, and your infographic will do what long technical documents cannot, helping people understand, remember, and share new ideas. Whether your topic is artificial intelligence, smart devices, or cloud systems, a thoughtful visual explanation turns curiosity into understanding.